
In 2015, Romanian companies generated a combined turnover of €262bn. For 2025 we estimate €558bn, 2.1 times as much, an average growth of 8% a year in EUR. And 2025 was not a lost year: companies that reported in both 2024 and 2025 grew by another 6%.
We built a proprietary database of every Romanian company that files annual financial statements, over 11 years: almost 9 million company-year records, 20 indicators per company, across 88 sectors and 42 counties. We used it to answer a simple question: where is money made in Romania? The answer has seven parts.
The message in short: Romania is growing, and the data shows where. Growth comes from productivity, concentrates in a few large companies, accelerates in specific counties and is led by services such as healthcare and IT.
1. The market doubled in ten years
From €262bn to €558bn between 2015 and 2025: a corporate economy twice the size. Anyone building a business plan should calibrate assumptions on today's figures, not on intuitions formed ten years ago.
2. Growth came from productivity, not from hiring
Turnover per employee doubled, from €66k in 2015 to €137k in 2025, while the number of employees stayed at about 4 million. And 42% of companies have no employees at all.
3. Profits rose five-fold, but margins are tightening
Net profit rose from €6bn to €33bn. The net margin peaked at 7.7% of turnover in 2022 and eased to 6.0% in 2025, and 35% of companies still report a loss. A realistic plan starts from the typical margin of its sector and county, not from turnover.
4. A few companies generate most of the business
About 6,100 companies with turnover above €10m, under 1% of the total, generate 65% of turnover and 40% of jobs; the top 100 alone generate 23%. At the other end, three quarters of companies turn over less than €100k a year and the median company makes €49k. The right benchmark for a new business is the typical company in its sector, not the average.
5. Bucharest–Ilfov dominates, but the regions grow faster
Bucharest and Ilfov generate 43% of national turnover. The fastest growth is elsewhere: Bacău grew 13% a year, the fastest in the country, and Cluj, at 10% a year, reaches €27bn in 2025, level with Timiș. The pace gap between the most and least dynamic county is fourfold.
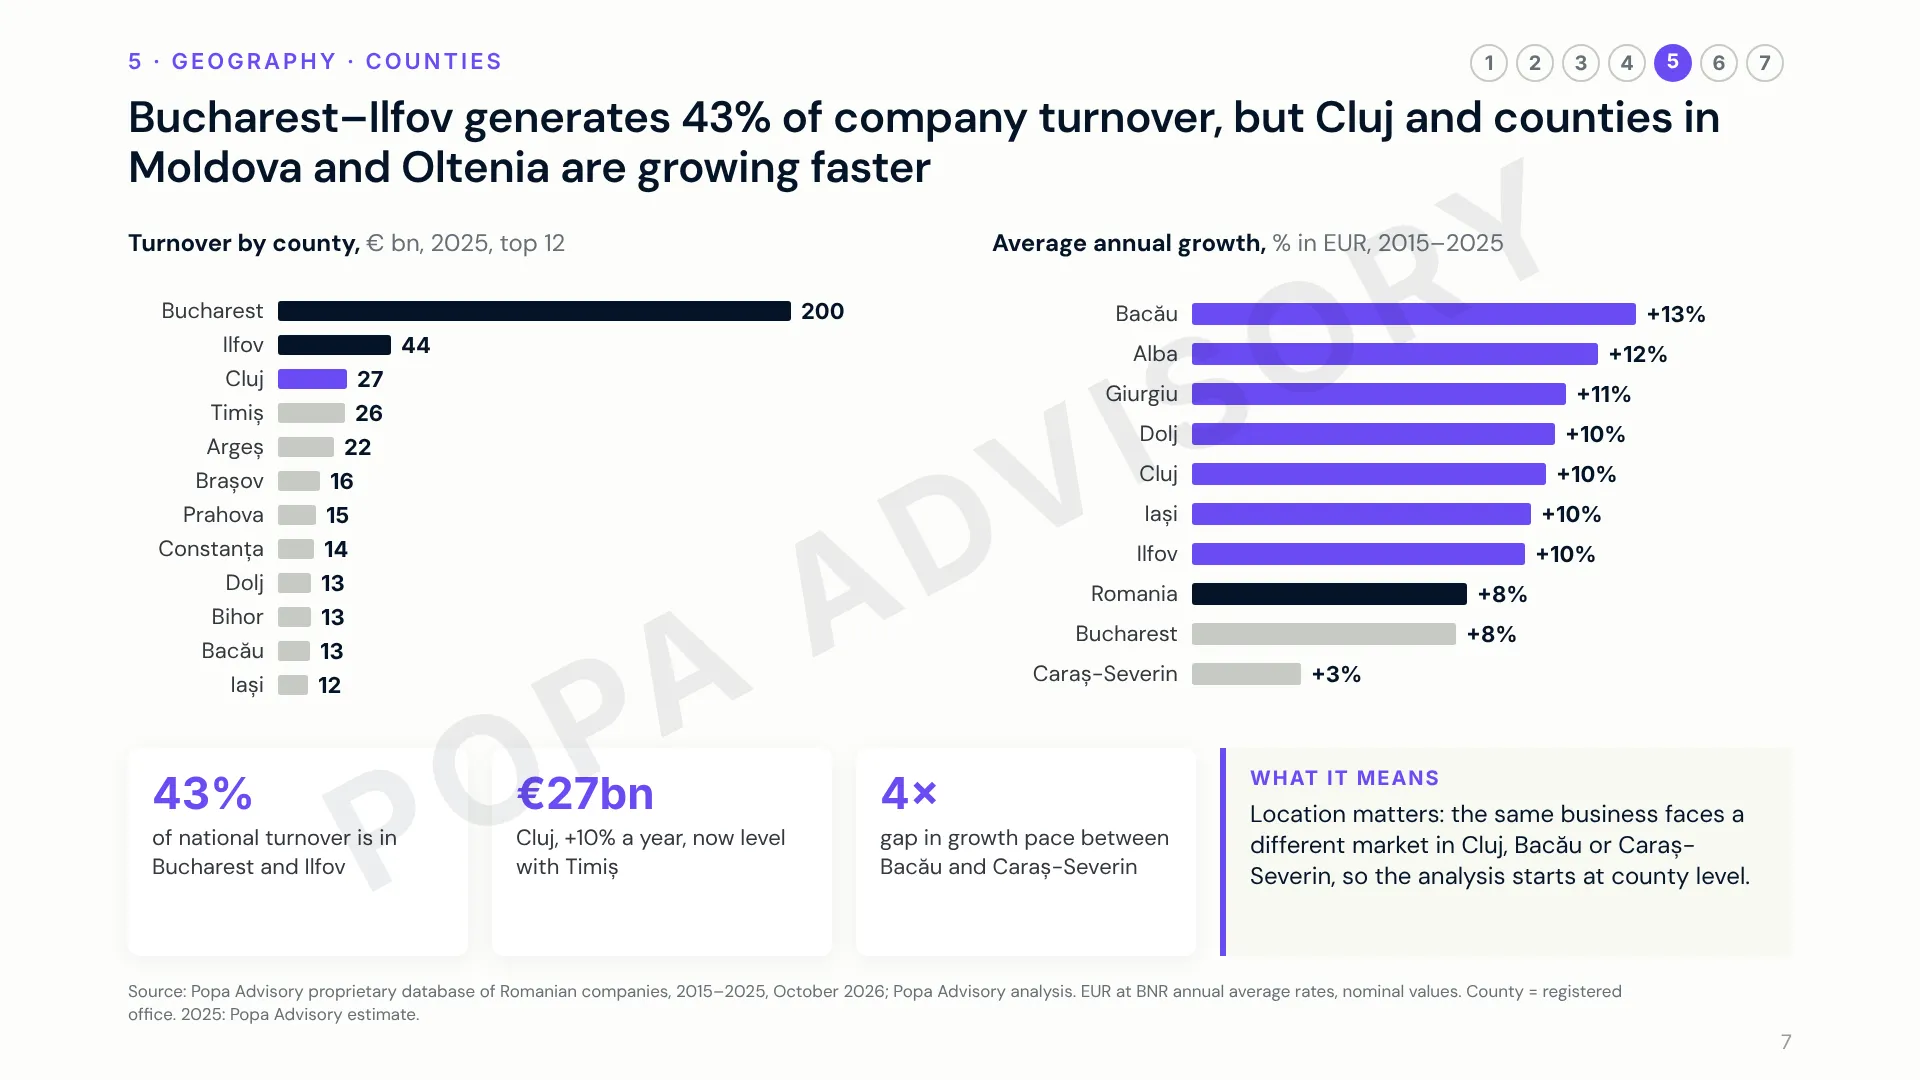
Turnover by county (€ bn, 2025) and average annual growth (2015–2025).
6. Services grow fastest, with healthy margins
Private healthcare grew 17% a year, IT 15% and private education 14%, against 8% for the economy. Net margins are about 15% in healthcare and 14% in IT, compared with 3–4% in trade, the largest sector. The number of healthcare companies rose from 13 thousand to 34 thousand, and in IT from 12 thousand to 38 thousand.
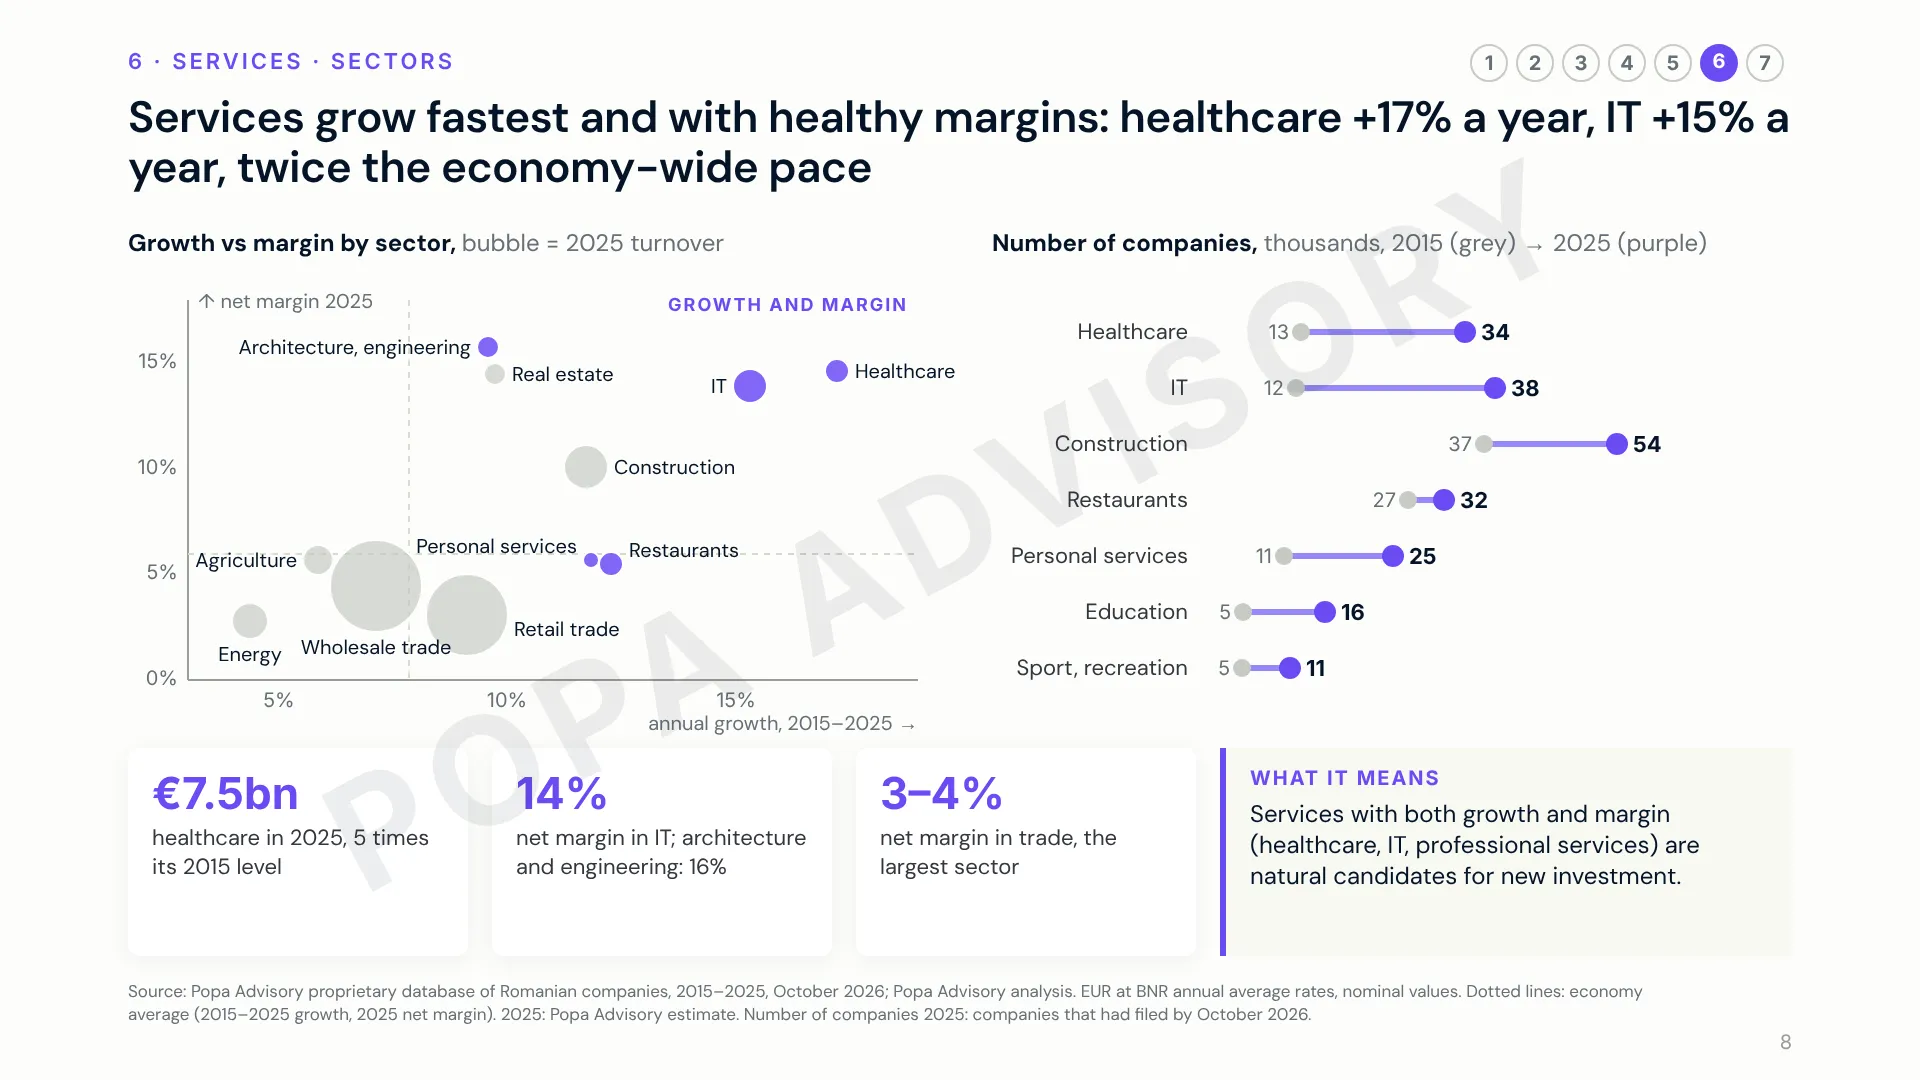
Growth vs net margin by sector, and number of companies 2015 vs 2025.
Local services all grow fast, 9–17% a year, but their economics differ widely. A typical healthcare company turns over €53k a year and only 23% of the sector reports a loss; in restaurants, 43% reported a loss in 2025; a typical beauty salon turns over €16k. A concrete example from our database: 722 dental companies in Cluj county have already filed for 2025, 3.4 times as many as in 2015, with a median turnover of €55k and a 16.5% net margin.
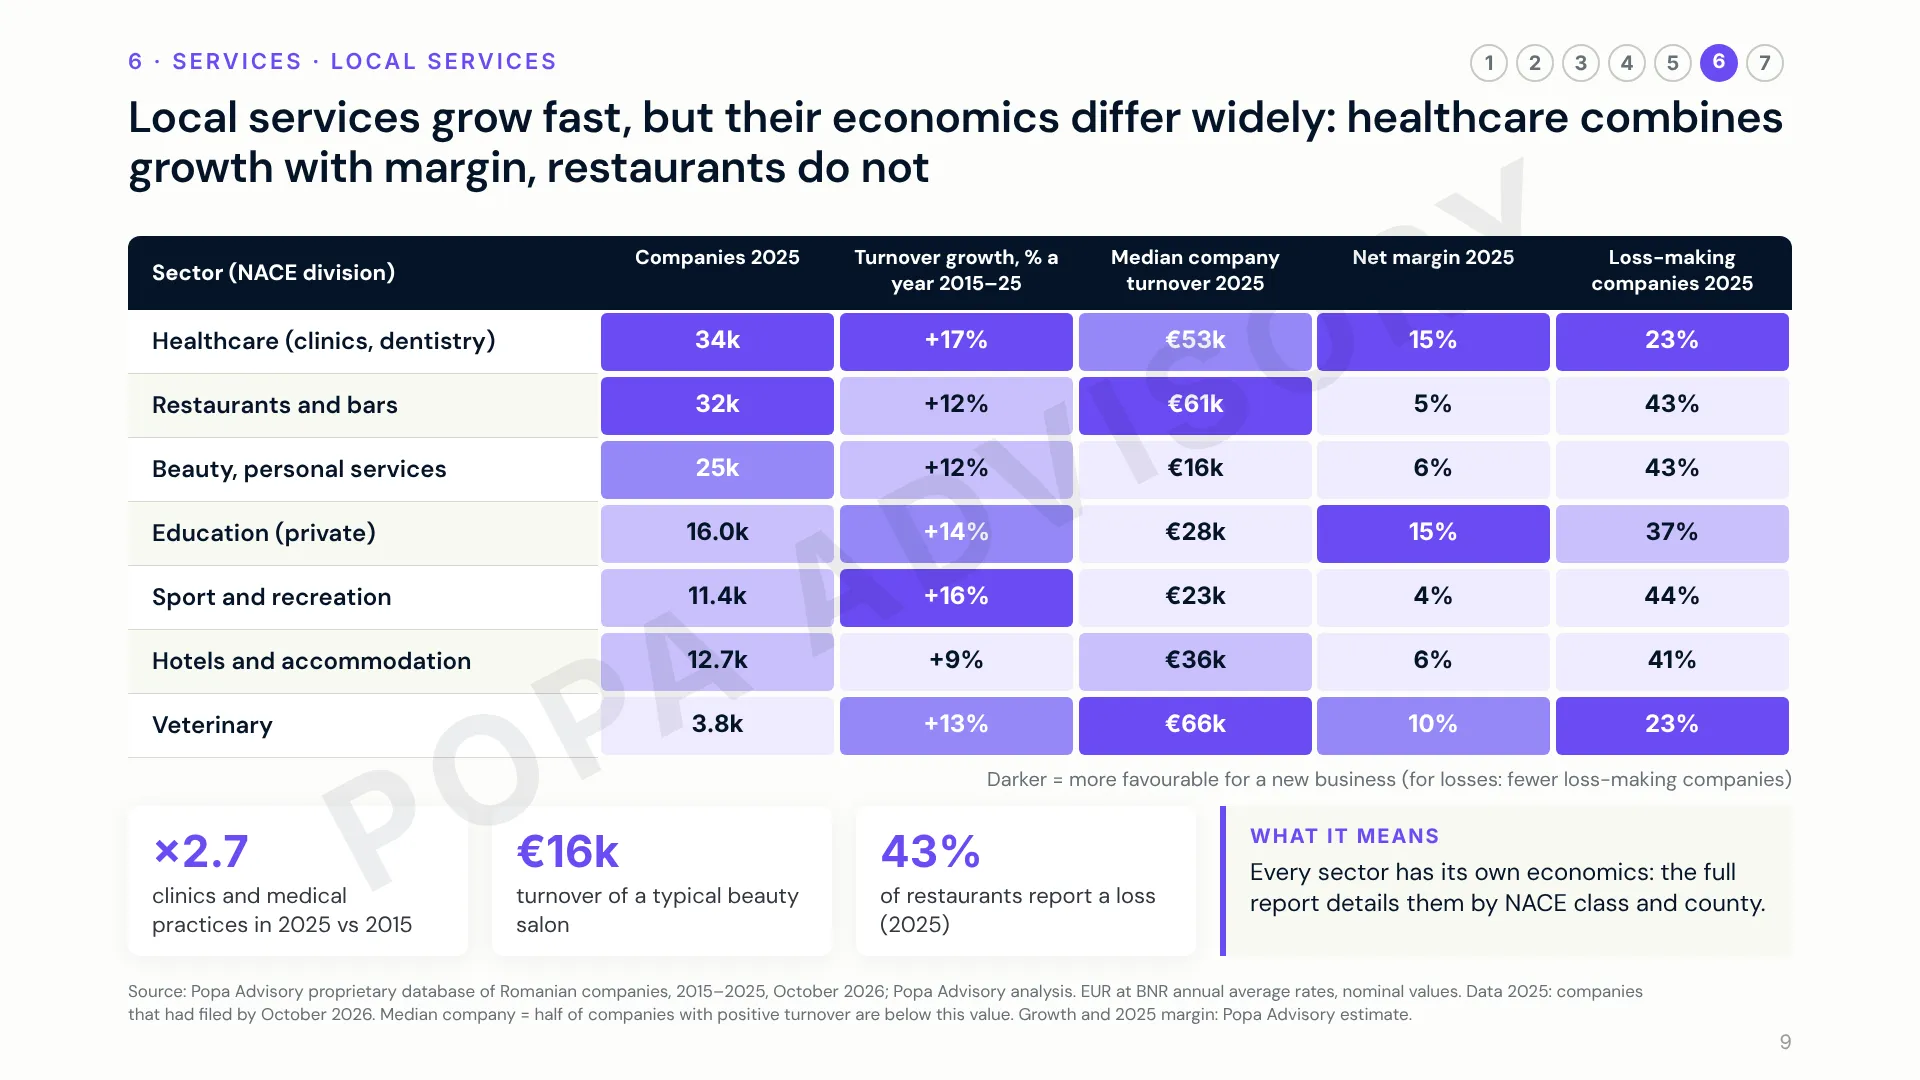
Local services: companies, growth, median turnover, margin and loss-making share.
7. The market renews itself continuously
On average about 97 thousand new companies appear every year and about 65 thousand leave the market. Survival is not guaranteed: of the companies that appeared in 2016, only 57% were still reporting in 2024. A plan built on real data improves the odds of being among the 57% who stay.
What it means for you
- If you are starting a business: begin with the typical figures for your sector and county: turnover per employee, margin and survival rate.
- If you are investing: services with both growth and margin, such as healthcare, IT and professional services, are natural candidates.
- If you are choosing a location: the same business faces a different market in Cluj, Bacău or Caraș-Severin.
Download the summary
The full summary, with all 7 arguments and the charts behind them, is free to download on this page. To discuss your sector and county, I run a three-hour strategy context workshop, with the full report and Excel workbook included. Write to dragos@popaadvisory.com.
Dragos Popa, Popa Advisory · Source: Popa Advisory proprietary database of Romanian companies, 2015–2025, October 2026. Nominal values in EUR at BNR annual average rates. 2025: Popa Advisory estimate. Total company turnover exceeds GDP because it includes sales between companies.